Python/scikit-learnのRandomForestでもirisの分類をしてみる

昨日のPySparkのRandomForestを使った記事に引き続き、今日はscikit-learnのRandomForestを使ってみます。
データの読み込みとプロット
>>> import matplotlib.pyplot as plt
>>> import sklearn.datasets

>>> iris = sklearn.datasets.load_iris()
>>> features = iris.data[:, [0, 2]]

>>> plt.scatter(*features.T, c=[['orange', 'green', 'blue'][x] for x in iris.target])
>>> plt.show()
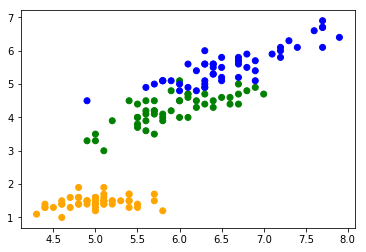
昨日とほぼ同じです。今回も長さのデータだけで幅は使いません。
訓練用とテスト用のデータを分ける
精度を測るべく、訓練用とテスト用のデータを分けます。 昨日と同じく7:3の割合で行きます。
>>> import sklearn.model_selection

>>> train_x, test_x, train_y, test_y = sklearn.model_selection.train_test_split(features, iris.target, test_size=0.3)
x(特徴量)とy(ラベル)が別々になっているので、PySparkよりちょっと面倒臭い感じがする。
学習器を作って学習
昨日のと違って前処理をしていないので、かなりシンプル。
>>> import sklearn.ensemble

>>> rf = sklearn.ensemble.RandomForestClassifier()
>>> rf.fit(train_x, train_y)
PySparkの場合と違って、fitの戻り値を保持する必要はありません。
実行して、精度を確かめる
学習が終わったら、実行してみましょう。
>>> prediction = rf.predict(test_x)
>>> print(prediction)
[0 2 2 1 1 2 0 0 2 2 2 0 0 2 2 2 0 0 1 2 2 2 2 2 0 0 2 1 0 1 2 0 0 1 1 1 0
 0 1 1 0 2 1 1 1]
こんな感じ。predict()を呼ぶと分類した結果が入ったnumpyの配列が返ってきます。
分類器自体に精度を計算するメソッドがあるので、それを使えば簡単に精度を確認出来ます。
>>> accuracy = rf.score(test_x, test_y)
>>> print('accuracy {0:.2%}'.format(accuracy))
95.56%
実行し直すのでデータ量が多い場合は時間が掛かっちゃいそうな気がします。 分類結果も使うのであれば、自分で計算した方が良いかもしれません。
どこを間違えたのかプロットしてみる
>>> plt.scatter(*test_x.T, c=[['orange', 'green', 'blue'][answer] if answer == predict else 'red' for answer, predict in zip(test_y, prediction)])
>>> plt.show()
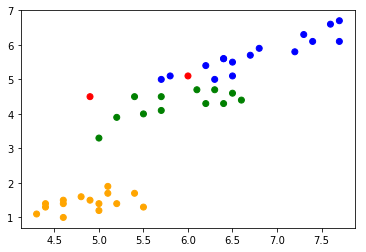
昨日のものとほぼ一緒。赤い点が間違えた所です。
scikit-learnもmatplotlibもnumpy.arrayを使うので、ほぼ何も変換せずに使えます。せいぜい転置してるくらい。
まとめ
繋げると大体以下のようになります。
import matplotlib.pyplot as plt
import sklearn.datasets
import sklearn.ensemble
import sklearn.model_selection


# データの用意
iris = sklearn.datasets.load_iris()
features = iris.data[:, [0, 2]]

train_x, test_x, train_y, test_y = sklearn.model_selection.train_test_split(features, iris.target, test_size=0.3)


# 学習
rf = sklearn.ensemble.RandomForestClassifier()
rf.fit(train_x, train_y)


# 評価
accuracy = rf.score(test_x, test_y)
print('accuracy {0:.2%}'.format(accuracy))


# 結果のプロット
prediction = rf.predict(test_x)

plt.scatter(*test_x.T, c=[['orange', 'green', 'blue'][answer] if answer == predict else 'red' for answer, predict in zip(test_y, prediction)])
plt.show()
いやあ、超簡単。 とりあえずこっちでやって、時間が掛かりそうならPySparkに移行するのが良いのかもしれません。 大まかなプログラムの流れは変わらないですし、移行するのはそんなに問題にならなそう。